
how did each ethnicity vote in each state?
education as the path to victory.


I saw this post by Cremieux, sourced from here, and my first thought was, “can I see this map broken down by ethnicity?” I couldn’t find such a map, so I decided to make it myself.
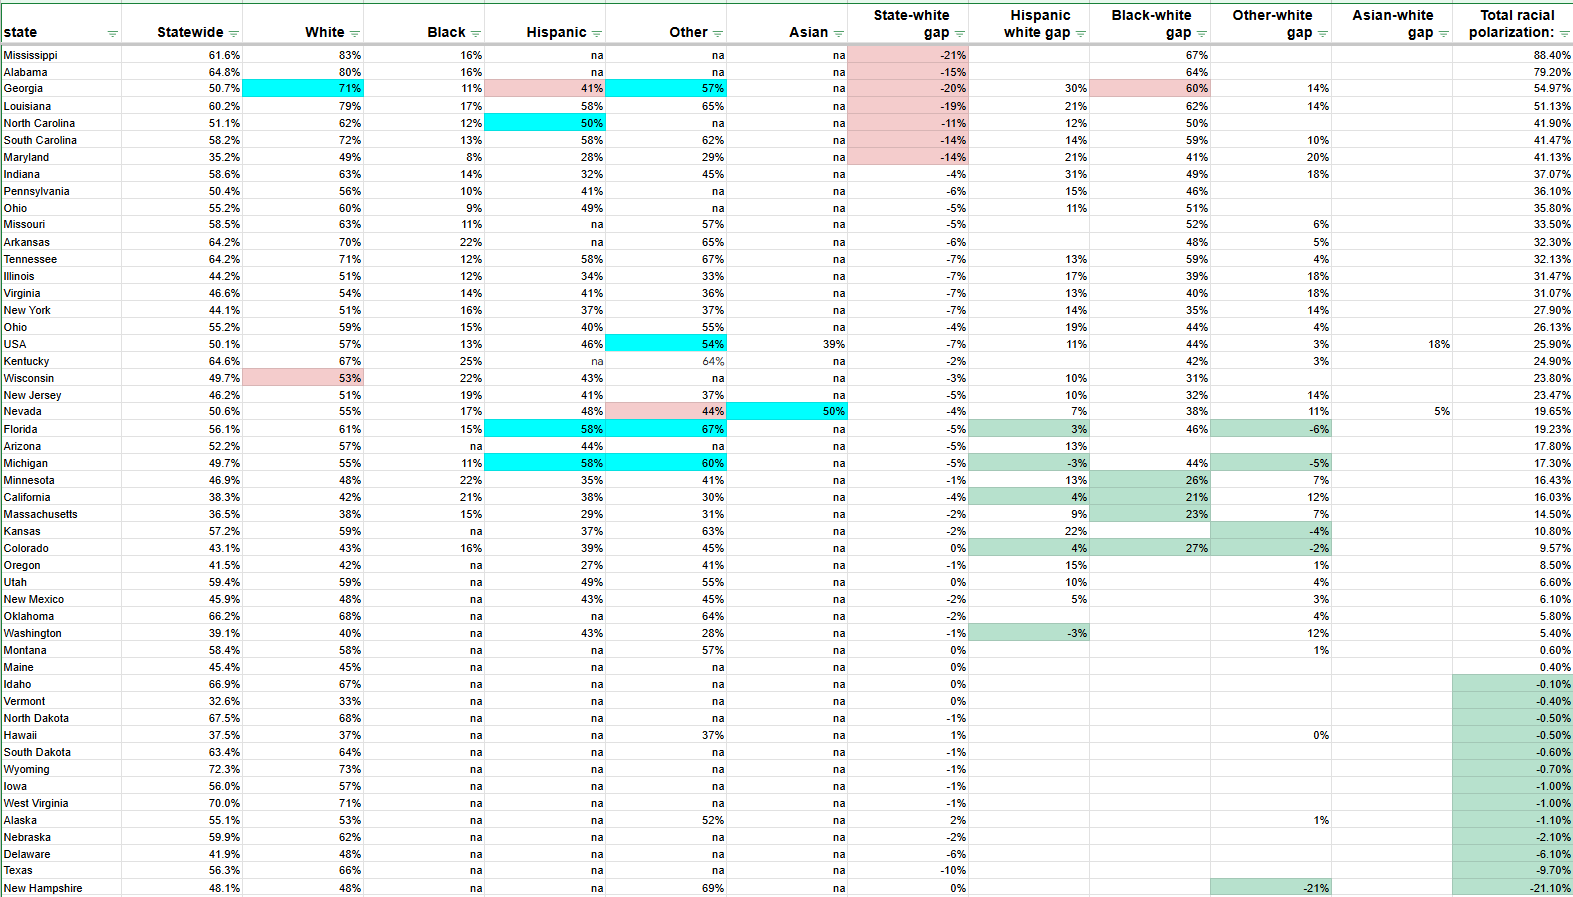
First, I use national exit polls from CNN. These aren’t perfect, but will reliably show us differences between states. Unfortunately, CNN had a lot of missing data:

Hispanics were more Republican than whites in Michigan. This is a stunning, never-before-seen occurrence.
Whereas whites differed by 18% between Georgia and Wisconsin, Hispanics differed by 17% points. This implies that Hispanics have a similar “national cohesion” as whites. Blacks only varied by 8% between Ohio and Nevada.
“Other” varied the most geographically, from 67% in Florida to 44% in Nevada, a 23% gap.
I wanted to get data for all 50 states, so I went over to Washington Post to fill in data for Pennsylvania.

After getting some black and Hispanic data from WaPo, I went over to ABC to get some Wisconsin data.

Wisconsin was surprising for the high percentage of blacks who voted for Trump.
Finally, for all the rest of the non-swing states that no one cares about like California, I had to head to Fox News. The idea that California votes Democratic because of non-whites was quickly debunked.
I realized I didn’t have data on black voters for Texas, so I went back to ABC. This allowed me to get data on Asians and Hispanics too. I am concerned that by mixing together Fox, ABC, and WaPo, I’m creating a Frankenstein’s monster of exit polls. But we will bravely sally forth.
Apparently, Texan Asians voted for Trump by 55%.
14 States where ethnicity didn’t matter:

In these states, either whites were just as liberal as non-whites, or non-whites were just as conservative as whites, or there just weren’t enough non-whites to affect the election (<1% difference between white vote and state-wide vote). Alaska stands out as a state where the non-white vote for Trump exceeded the white vote for Trump.
14 states where Trump lost whites:

Many of these are highly educated coastal states, so the fact that Trump is losing among whites these is not good for the hope of him establishing a dictatorship. I would love to get this data on a county-level to see where Trump loses whites in key cities like New York. It’s out there for the general vote, but not for the white vote.1
Trump won >20% of blacks in 5:

He may have also won >20% of blacks in states like Montana, but the sample size was too small for exit polls to report on this, so it doesn’t really matter.
Trump won <12% of blacks in 7:

Each of these states has really bad inner cities. Not sure about Hartford, Connecticut, but apparently something is going on there.
Wisconsin blacks had a very different pattern from Michigan blacks. This implies that the city of Detroit has a unique effect. Maybe endemic poverty in inner cities is driving blacks to vote Democrat, while rural or suburban blacks are more open to Republicans.
Trump won >50% of Hispanics in 6:

Trump alienates Michigan blacks, but is loved by Michigan Hispanics. Trump supporters in these states should encourage Hispanic immigration.
Trump won <50% of Hispanics in 11:

Most of these states are very liberal, with the exception of Indiana and Kansas. My theory of why Trump is doing so poorly with Hispanics in Indiana and Kansas is that all of the Hispanics move to Indianapolis or Kansas City. As a result, they are much more urban, and tend to vote Democrat. Indiana and Kansas are in danger of turning blue with more immigration.
Trump won >60% of “Other” in 10:

With the exception of New Hampshire, these are all conservative states. This implies that as whites mix with non-whites, their children will defer to the political positions of their white family. In some cases, “other” included Asians or native Americans, but in most states “other” defined mixed race individuals. Looking forward to 2028 when Fox News starts breaking out Asians into their own category.
Where did non-whites hurt Trump >3%?

Non-whites hurt Trump the most in Mississippi, by -21.4%, but he still won the state. The biggest penalty where he lost was in Maryland, at -13.8%.
This number was derived by subtracting the state-wide total from the white vote. However, after California, the difference was minimal: less than 3%. There were few potential swing states where non-whites could be blamed for threatening Trump’s victory.
Generally speaking, other demographic factors, like age, education, religion, marital status, household size, and sexuality matter much more for elections than ethnicity.
However, there were four “swing-ish” states where Trump lost due to the non-white: New York, Illinois, New Jersey, and Virginia.
Assuming that non-whites shift more toward Republicans in 2028, this might help Republicans take back Virginia. But it probably won't help in New Hampshire, Minnesota, New Mexico, or Maine.
Hispanics and whites vote the same in 7:

In these states, there was less than a 5% gap between the white and Hispanic vote. In these states, mass immigration from Hispanics will likely not impact future elections, although mass immigration from Asians might be a different story.
It is possible that Hispanics in Michigan have a racist hatred for Detroit, and this causes them to love Trump. In Florida, the Cuban vote is important. In the others, whites are just very educated and liberal.
Where should GOP focus on Hispanics?

Virginia and Minnesota stand out as states where the Hispanic-white vote gap was 13%, but the election was within 5%. If Republicans can close the Hispanic-white vote gap in those states, similar to states like Florida and Michigan (<5%), they can make gains in 2028. If the Detroit thesis is correct, then this will mean campaigning on black crime. If the Hispanic-white gap begins to close in Georgia, we should expect Georgia to stop being a swing state, and start being solidly red again.
Ohio has a large black-white gap:

In Ohio, 60% of white voted for Trump, vs 9% of blacks. This makes Ohio the most racially polarized state outside the South. This may be because blacks in Ohio are more concentrated in cities with low economic growth, like Cincinnati, Cleveland, and Columbus. The former slave state with the lowest black-white gap was Virginia, where 54% of whites and 14% of blacks voted for Trump.
In states like California, Massachusetts, Minnesota, Colorado, and Wisconsin, the black-white voter gap was smaller than the Hispanic-white voter gap in Indiana. Although most of these states are liberal, Wisconsin is moderate.
“Other” beat whites for Trump in 6:

In Kansas, Michigan, and Florida, it is possible that “Others” are over-assimilating into conservative white culture (extreme white shift). In New Hampshire, Connecticut, and Colorado, “Others” are identifying with Trump despite the fact that their white neighbors do not.
Indiana has unique racial polarization:
Many former slave states (including Maryland) have large racial gaps in voting between whites and non-whites. Indiana stands out as a state which never had slavery, but where the Hispanic gap is 31%, the black gap is 49%, and the “Other” gap is 18%. This might be a result of Indiana’s history with the KKK, led by David Stephenson. It may also be because non-whites in Indiana are not distributed throughout suburbs or rural areas, but are concentrated in urban areas.
The White Vote:

Here’s a map of the white vote. Illinois is surprisingly blue to me. Iowa, which is a conservative stronghold, had whites vote 57% for Trump.
White vote, but festive color scheme:

In this scheme, the yellow states are where the white vote is between 50-60%. There are weaknesses for Republicans in Arizona, Michigan, Wisconsin, and Nevada. Even if all non-whites stopped voting, the election would still be within a 10% margin in these states. Democrats could easily overcome that through the power of atheism, homosexuality, and education.
Further down the line, Democrats should be able to make progress in Montana, Iowa, Kansas, Ohio, and even Utah. If marital rates, church attendance, and household size decrease, and education and LGBTQ identification increases in these states, Democrats should be able to win the white vote in these states by 2040.
Black map:

As you can see, there’s no data for most states. That’s partially because some states were too small for pollsters to bother (Delaware) or there were very few black voters (Montana). From Cincinnati to Baltimore, blacks vote strongly Democrat. However, in Arkansas, Kentucky, Wisconsin and Minneapolis, they vote more Republican (up to 25%). This might be due to differential rates of black urbanization. In Minneapolis, it might have to do with a kind of reverse BLM effect.
Hispanics:

Hispanics clearly follow white political trends in each state. Hispanics in the south vote Republican. Hispanics on the coast vote Democrat. Exceptions included Kansas and Indiana. This might be due to Hispanic urban concentration in those states.
Asians:
I couldn’t find data on Asians outside of Nevada and Texas (50% and 55% for Trump). Nothing in California or New York. Very disappointing.
“Other”:

The “Other” category follows whites almost perfectly. These include Native Americans, sometimes Asians, and mixed race people. It could also include people who refuse to state their race. There are no big surprises here, except for New Hampshire where “Other” went 69% for Trump, and Indiana, where “Other” went only 45% for Trump.
Maybe the New Hampshire Others are very rural and watch the Hodge Twins and Andrew Tate, and the Indiana Others are relatively urban, so they prefer cross-dressing and watching anime.
It might also be the case that Others vote Republican when they feel safe and surrounded by non-threatening educated white people (New Hampshire), but they vote Democratic when they are surrounded by KKK rednecks (Indiana).
State-White Gap:

The state-white gap was found by subtracting the white vote from the state total vote, to see how much the white vote differed from the general vote. The deep South is at an extreme disadvantage due to blacks (minus 20%), but the rest of the country seems relatively unaffected. If all non-whites stopped voting in California, Republicans would only improve their margins by 4%. North Carolina is the swing state where the disadvantage is the greatest.
Hispanic-White Gap:

Republicans are alienating Hispanics in Georgia, Indiana, Kansas, Louisiana, and Maryland. They are outperforming with Hispanics in most of the southwest (with the exception of Arizona), Florida, Michigan, and Washington.
Black-White Gap:

Black people lag behind the white Trump vote the most in the former slave states, but also in Ohio, Indiana, and Pennsylvania. In the Northeast and West, Republicans do relatively well with blacks. If Republicans ever win more blacks than whites, it’s going to happen first in California before anywhere else. That’s still a 21% gap, so don’t expect that to happen by 2032. (The biggest swing this election for black voters was 13% in Wisconsin.)
Other-White Gap:

Republicans are doing terribly with Others in Indiana, Illinois, and Virginia. These are likely concentrated in Indianapolis, Chicago, and Nova. They are doing fantastic in New Hampshire, Florida, Michigan, and Kansas, where they are likely in a more rural or suburban environment.
Racial Polarization:

I took all of the racial gaps in voting and added them together. Since there was missing data, this isn’t necessarily accurate. It does essentially map onto the history of slavery and inner city segregation, with the exception of Virginia and Tennessee.
Polarization per black capita:

I subtracted the percentage of black people from the racial polarization score to obtain a “racial polarization per black capita” index. Texas, New Hampshire, and Delaware had relatively little polarization, while Alabama stood out as an extremely racially divided state.
Polarized per non-white capita:

Finally, I subtracted the number of total non-whites from the polarization index. The result was that Hawaii, California, and Texas were the least racially polarized, while the “mid-south” (an area between Pennsylvania and Louisiana) was more polarized.
Addendum: National trends
Now that I have completed the state-by-state breakdown, I want to cover some national polling:
Age:
Nationally, young whites (18-29) voted 49% for Trump, which was 13% less than Gen X whites (45-64). For blacks, there was no clear trend for age, and for Latinos, results were mixed. This implies that over the next 30 years, whites are going to shift, overall, 13% in favor of Democrats. This will stress Republicans in whiter states with moderate leanings, like Wisconsin, Michigan, Iowa, Pennsylvania, and Ohio.
Education:
Those who never attended college voted 63% for Trump; those with a graduate degree went 38% for Trump. The total effect of education was a 25% swing away from Trump, despite graduate degree holders being whiter than the general population.
College as a binary has little electoral impact on non-whites (2% difference), but it caused a 21% swing away from Trump among whites.
When broken down by gender, education caused a 22% swing away from Trump for white women (41-63), and a 19% swing away from Trump for white men (50-69). This suggests that white women are slightly more politically affected by education, but not by much.
If Democrats can increase the college educated population by 5% in states like Wisconsin, Michigan, and Pennsylvania, they can win these states. Unfortunately, college attendance in Michigan is falling. In Pennsylvania, for example, college enrollment dropped by -21.20% between 2010 and 2020. This is very bad for Democrats. States where enrollment grew included Idaho (47.00%), New Hampshire (184.00%), Texas (2.00%), and Utah (56.90%).


Religion, Marriage, and Sexuality:
White voters who described themselves as "something else" other than Christian/Catholic/Jewish went 43% for Trump. This would include white Buddhists, Hindus, pagans, Satanists, etc. On the other hand, white voters who said their religion was "none" only went 27% for Trump. This implies that atheism is much more effective than education in repelling whites from Trump.
Having children affected men more than women, 6% (60-54) toward Trump vs. 2% toward Trump (46-44).
Marriage impacted women slightly more: 13% shift toward Trump (51-38) for women; 11% shift toward Trump (50-49) for men.
LGBTQ status swung votes by 40% (13-53) away from Trump.
Urbanism and military service:
Military service swung voters 17% (48-65) toward Trump.
The rural-urban divide caused a shift of 26% (64-38).
Finances:
Those who were upwardly mobile (better off financially in 2024 as opposed to 2020) went 82% for Kamala; those who maintained their finances went 69% for Kamala; those who said they lost money went 81% for Trump. In this sense, poor personal finances caused a 67% swing toward Trump — even bigger than the effect of religion or LGBTQ status.
Immigration and abortion:
11% of those who stated that “illegal immigrants should not be offered a chance for legal status, and should be deported” were Kamala voters. These are more likely to be black and Hispanic voters.
10% of those who said abortion should be “legal in all cases” were Trump voters. We could call these the “Melania caucus,” or Hanania libertarians.
Party swapping:


4% of self-identified Democrats voted for Trump; 5% of Republicans voted for Trump. This could indicate that Democrats are more likely to switch their party affiliation, whereas Never-Trumpers are more stubbornly holding onto the idea that they are the "real conservatives."
Of Biden voters, 6% switched over to Trump. Of 2020 Trump voters, 4% switched over to Kamala. Those who voted third party in 2020 swung 10% toward Trump; those who did not vote swung 4% for Trump. The story of 2020 doesn’t seem to be about mass conversions from Biden to Trump, but of low turnout.
Summary:

The biggest factor in this election was upward mobility. Despite the job market, stock market, and inflation all improving over the last two years, individuals who lost their job or become “underemployed” voted massively for Trump. Those who got promotions voted massively for Kamala. This doesn’t necessarily reflect a long term trend, since a bad economy always hurts the incumbent and favors the challenger. We will have to revisit this issue in 2028 to see if upwardly mobile vote against Republicans again, or if they switch around.
The second biggest factor was religion. This is a consistent trend throughout elections: Christians vote Republican, non-Christians vote Democrat. As the number of Christians continues to fall, this spells doom for Republicans. A 3% reduction in Christianity will cause Republicans to lose in Wisconsin, Michigan, and Pennsylvania. Some of this is due to a decline in belief, but some of it is due to an influx of secular or non-Christian immigrants.

A projection by Axios suggests that Christianity will decline from 64% to 54% or 35% by 2070. This implies a decline per year between 0.2% and 0.41%. As such, we should expect religion to decline by 3% in the next 7 to 15 years. This forecasts a major breakthrough for Democrats in the 2032 or 2036 elections.
The third biggest swing factor was LGBTQ status. Between 2012 and 2023, LGBTQ identification increased from 3.5% to 7.6%. Assuming this trend continues linearly, by 2036, increasing LGBTQ identification alone should grant a decisive victory to Democrats in the three rustbelt swing states. Assuming this trend is exponential, however, it may even play a significant role in 2028.
Increasing urbanism is probably not going to cause Republicans to lose in the next two elections:

Race alone doesn’t determine elections:
In Mississippi, the black-white vote gap was 67%. However, the question of economic mobility (downward or upward) was just as definitive in the 2024 election. Whites who lost their job voted overwhelmingly for Trump, while whites who got promotions voted overwhelmingly for Kamala.
Because of the small percentage of blacks nationally (13%) and their lower voter participation rate, and their small presence in swing states, the black-white vote gap doesn’t matter very much. It only impacts solidly red states in the deep South.
The Hispanic-white vote gap is a bit more important for swing states. It was, at most, 31% (in Indiana). That was less important than economic mobility, religion, and LGBTQ identification. On average, however, the Hispanic-white gap was only 12%.
That was much smaller than all the previous categories, as well as the impact of urbanism, education, and military service. In other words, whether or not a voter is Hispanic was less influential on their vote than whether or not they were gay, promoted, Christian, rural, graduated, married, young, or a veteran. All of these categories had greater electoral impact, on average, than Hispanic identity.
Demographics are destiny. But which kind? The average gap between white voters and racially mixed voters was 6%. That is extremely small, almost as small as the difference between whether someone had kids or not.
The power of education:
If Democrats imported 30 million undocumented Hispanics over the next 10 years (23% of the population of Mexico), this would shift the country to the left by 1.2%.2 This is because only a small percentage of them would become citizen voters, and those who did become citizens have a low voter participation rate, and those who do move here end up moving to states that are already solidly blue. The next census isn’t until 2030.
At the same time, however, mass immigration would cause Democrats to become more unpopular with voters, which would wipe out this shift. So much for “The Great Replacement!” Instead, if Democrats would just enroll 12.8 million additional whites in colleges and universities, this would accomplish a larger electoral shift, of 1.8%, with no backlash.
![College Enrollment Statistics [2024]: Total + by Demographic](https://substackcdn.com/image/fetch/$s_!odtA!,f_auto,q_auto:good,fl_progressive:steep/https%3A%2F%2Fsubstack-post-media.s3.amazonaws.com%2Fpublic%2Fimages%2F28695f1a-7db1-4efa-a26a-c2c2907c4dba_800x527.png "College Enrollment Statistics [2024]: Total + by Demographic")
In 2010, 6.79% of the population was enrolled in college. In 2022, that number fell to 5.58%. In 2022, 34% of high school graduates neglected to apply to college because of the cost. That’s a total of 1.26 million students per year who skip out on college. This would add $14.6 billion to the budget, which is fairly small compared to the $174.9 billion of federal funding for college in 2021. By increasing spending on education by just 8.3% (maybe by making cuts from K-12 by stripping teacher’s unions of their state enforced monopoly), Democrats could invest in a much stronger electoral future than Mexican immigration could ever achieve.
By making college free for low-income students, Democrats could enroll 12.8 additional college students over the next 11 years, and wipe out Trump’s electoral victory.
Trump won counties in Texas which are 90% Hispanic. But he lost college educated white voters. College educated white voters are dedicated, active, and loyal members of the Democratic Party. Instead of importing new voters (who are turning toward Trump), Democrats should focus on converting white voters into Democratic voters through the power of education.
Democrats could even be more targeted by specifically enrolling whites in swing states, like Arizona, North Carolina, Michigan, Wisconsin, Pennsylvania, and Georgia. In states that are decided by less than 100,000 votes, education matters.
Examples:
Take Michigan, where Trump won by less than 80,000 votes. There are 466k students enrolled in Michigan colleges. Over 10 years, Michigan enrollment has dropped by -33.1%. What if Michigan could turn those numbers around, and increase enrollment by 10% per year? That would add 46,646 enrolled students to Michigan per year, and as those students graduate, they would continue to lean Democratic for the rest of their lives.

Among 10 whites with no degree, there are 6.6 Trump supporters. Among 10 whites with a degree, there are only 4.5 Trump supporters. That means giving 10 people a college degree results in 2.1 less Trump supporters. In other words, enrolling 46k new students would remove 9,796 votes from Trump per year. Over four years, that’s 39,184 votes. Not enough to win in 2028, but maybe in 2032.
There are 316,129 students in Wisconsin, and enrollment is down -17.7% over 10 years. Trump won by less than 30,000 votes. If Democrats can enroll 35,714 new students per year, a 10% increase per year, they can win in 2028.
All of this would require government spending. The cost of tuition for colleges in Wisconsin is $11,606 per year. That means Democrats need to spend an extra $414 million per year. Where are they going to get that money?
Maybe they could find it somewhere in the one billion dollar campaign for Harris.
Mass immigration is incredibly unpopular, even among Hispanics. However, free education is popular, and has a demonstrable electoral impact. If Democrats want to win, they should close the border and open up the schools.
We should abolish the census and combine the census together into the election. In order to vote, you have to also fill out a bunch of census questions. The data is anonymized so your ballot is secret, but then we have perfect county-level data on all voters.
We’d also be speaking Spanish and cartels would run the country, but Republicans would still have a chance to win in Wyoming, West Virginia, North Dakota, Idaho, Oklahoma, Alabama, Kentucky, Tennessee, Arkansas, and South Dakota.
The number I found for Asians in Nevada was 57% for Trump
“Other” and “Amerindian” probably cannot be trusted to be meaningful in any data.
“Racial Polarization”, I would like to add, seems to correlate somewhat with mean IAT scores of Whites, which itself correlates with % White. Texas is the exception. White people become more racist when more exposed to minority behavior, but one might expect that minorities become less racist when exposed to white behavior. Because white people are, you know, nice people