


does African "ghost DNA" predict wealth, IQ, or fertility?
Data from 195 countries, plus 144 black plurality counties of America.
When I discuss immigration and open borders, the most vicious attack I receive is regarding African immigration. Africans, according to my critics, are genetically predisposed to poverty and lack intelligence when compared with Arabs, Iranians, Indians, Pakistanis, Polynesians, or Bolivians. African immigration, for these reasons, is especially bad and heinous.1
Some go as far as to claim that Africans are a separate sub-species from all other humans, who are uniquely dumb, hyper-fertile, and violent, because they have “ghost DNA” from Homo Erectus.
How well does African ancestry predict wealth and IQ? When we increase or decrease African ancestry incrementally, does wealth and IQ increase or decrease uniformly or linearly?2
The argument I present here does not disprove racism, hereditarianism, or HBD. Rather, it is a very specific argument regarding the supposed uniqueness of Africans. As we will discover, after controlling for environmental conditions, Sub-Saharan African IQ likely exceeds that of Kosovo, Nepal, Panama, Afghanistan, India, and Pakistan.3 This defies the racial essentialist perspective, which would categorize all “Caucasian” ethnicities as superior to all “African” ethnicities, because of skull shape or something.4
Before we go through the data, I will offer conclusions and hypotheses:
Agricultural and pastoralist populations in Eurasia underwent selection for IQ within the last 10,000 years. This selection for IQ resulted in an increase of 10-20 IQ points, and was the most intensive between 6,000 BC and 2,000 BC, during which time European Hunter Gatherers were replaced by a combination of agriculturalist and pastoralist invaders.5
It is plausible that European Hunter Gatherers, prior to 10,000 years ago, fell within a “basal Homo Sapiens hunter gatherer” IQ range of between 70 and 90 IQ. The Europeans with the greatest amount of hunter-gatherer ancestry, the Saami,6 have high spatial intelligence, but their verbal intelligence is relatively low, suggesting that “European aboriginals” were not especially high IQ.7
Prior to 10,000 years ago, global distributions of IQ were fairly uniform, with a median of 80 IQ, with local variations ±10 IQP. There was no great difference between Africans, Pacific Islanders, Eskimos, or any other group of hunter gatherers.
The “cold winters hypothesis” is not predictive for hunter gatherer populations. Hunter gatherers in cold environments, like Siberians, Eskimos, and Inuit show no evidence of selection for intelligence. Selection for intelligence occurred as a result of farming and pastoralism in Anatolia, China, and the Pontic-Caspian steppe.
After controlling for environment, the IQ of Africans is likely within 5 points of all other racial groups, including Pacific Islanders, Amerindians, Non-Northeast Asians (Siberians, Central Asians, South Asians, West Asians).
The supposedly unique poverty and low cognitive ability of Africa is not unique at all. 2 billion non-Africans fall within the “African range” of IQ and poverty.
National IQs

The graphic shows every country with a lower national IQ than Bermuda. If you can’t read the key:

Bermuda is a majority black country, with 52% of the country identifying as black, and has an IQ of 89.5, and a GDP per capita of $123,091.
Bermuda, like many other Caribbean countries, benefits from tourism. However, Haiti also has access to the Caribbean Sea. How is it that Bermuda benefits from tourism, but Haiti does not?
One explanation is that Bermuda is less African than Haiti. However, Yemen is only 45.7% African,8 which is less African than Bermuda, but Yemen is even poorer ($533 GDPPC) than Haiti ($1,693 GDPPC). If racial ancestry determined wealth, and African ancestry destroyed wealth production, then it would be impossible for Haitians to be 3.2x richer than Yemenis. Clearly, environmental factors are far more important than the alleged genetic determinants, at least in the case of these individual countries.
When I speak of environmental factors, I am including war. War is determined not by innate genetic propensities — that might explain crime, but not war. India, for example, has an IQ of 76, but due to geopolitical stability, it has avoided serious conflicts (>1% deaths) for decades.
Let’s look at the GDP per capita of India:

Here are some black countries that are ~10x richer than India:
Turks and Caicos Islands is 87% black, and the GDP per capita is $30,438.
Barbados is 92.4% Black, and the GDP per capita is $22,672.
Saint Kitts and Nevis is 92.5% black; GDP per Capita is $22,553.
Yes, these countries live off tourism, sure, but none of that tourism would be possible without security. The difference between Barbados and Haiti isn’t genetic, it’s geopolitical.
I might be cherry-picking these examples. To get the broadest possible view, let’s construct a data set with all 195 countries, plus 144 black-plurality counties of America.
Let’s dig into the data:
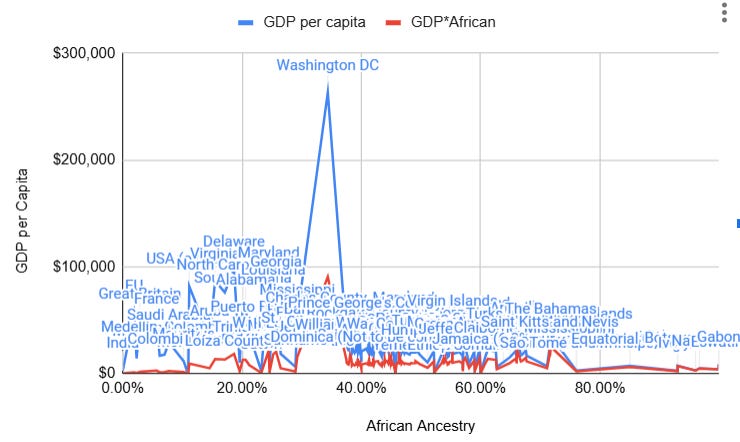
This is a totally unreadable graph, except for one data point: Washington DC is really rich, despite having a lot of African ancestry.

Here are 339 data points, from 195 countries, plus 144 states, counties, and territories.
The correlation between African ancestry and GDP per capita at the global scale is R2=0.04.

A moving average shows a sudden drop off and general decline in GDPPC after 25% African ancestry. However, there seems to be no negative effect to having 1-24% African ancestry at a national scale.

If we “maximize,” meaning that for a given African ancestry, we only look at the highest GDPPC9, The correlation increases to R2=0.24. Still, there is little relationship between African ancestry and GDP per capita between 35% and 50%.
The sudden drop off between 70% and 80% suggests one of two things:
Homogeneous African societies (>80% African) are exponentially worse at generating wealth than more heterogeneous societies (<70% African);
This is an artifact of geography, not ancestry.

Here is the “minimum” for each X value, where X=African Ancestry. If we exclude >70% African regions (to control for geography), the correlation goes away.

For minimum values, when we exclude the 40 blackest countries from the dataset, there is almost no correlation between African ancestry and GDPPC (R2=0.07). Remember, if the genetic hypothesis were correct, then countries which are 50% African should be much poorer than countries which are 30% African. This isn’t the case.

For maximum values, the story is different. African ancestry over 40% seems to create a hard “ceiling” (around $30k GDPPC).
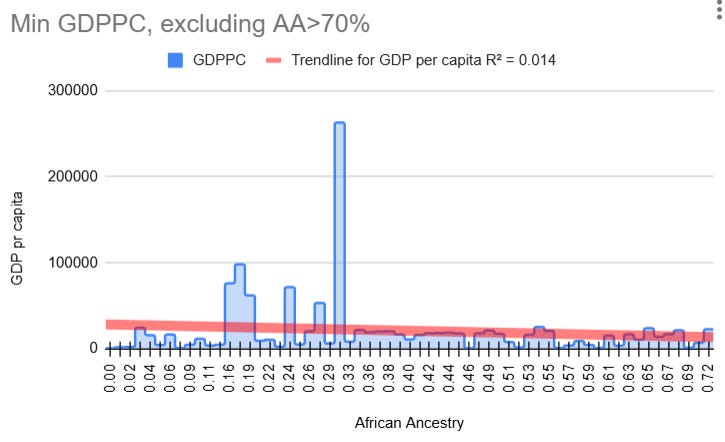
Looking at minimized Y values again, it is clear that “not being black” does not protect a country from being poor. Non-black countries are entirely capable of being extremely poor, with no African admixture required. This demonstrates that African admixture is not a necessary component of poverty.
Now Onto IQ

Instead of trying to predict GDP per capita using African ancestry, let’s try using IQ. As it turns out, IQ is a much better predictor of wealth than African ancestry.
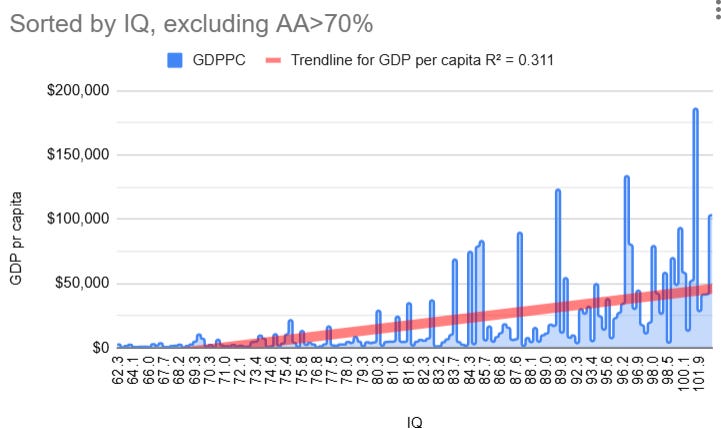
The relationship between IQ and GDP per capita is a strong (R2=.31/.37) and consistent pattern. IQ predicts wealth much better than African ancestry. But how well does African ancestry predict IQ?

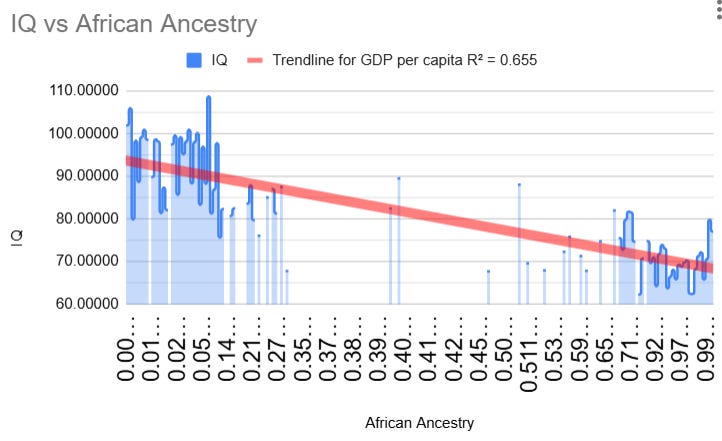
It is possible to have a 50% black country with an IQ of 88; it’s also possible to have 0% African ancestry with an IQ of 71. The general trend is that Africans do not have a radically different IQ range than other non-Eurasians.
The reason why there is so much data missing here is because I didn’t have IQ data on USA counties. This is something we could interpolate in the future by using county-level PISA or SAT scores.
These are the maximized Y-values. So you can see that the smartest countries (East Asia) have little African ancestry, while those with the most African ancestry (70-99%) reach heights of 80 IQ. Assuming that East Asia has optimized its environment, and Africa has the worst possible environment, then controlling for environment should help narrow this gap further.
This is the basis for my argument that the “idealized” IQ of Africans is 80, not 62. 80 is higher than Pakistan and India. In an “optimized” environment, barring inbreeding, 80 IQ points seems like the “basal IQ” of most of humanity.

Here are the min scores. As you can see, between 0-25% African ancestry, there is very little correlation between African ancestry and IQ. Let’s zoom in on this.

Below 25% African ancestry, African ancestry has very little correlation with IQ (R2=.02). One explanation for this is that Eurasian societies which engaged in the slave trade did so because they had naval capabilities. Societies unable to engage in this trade, due to isolation or lack of naval capacity, aren’t doing as well.
Scatterplot time!

Bermuda and DC are extreme outliers.

My argument for a “basal human IQ” around 80 hinges on this graph. If you exclude East Asians, Jews, and Europeans, the other 70% of humanity seems to cluster tightly around 80 IQ.
GDPPC*AA (thousands)

In this chart, I multiplied African ancestry by GDPPC. For countries with an African Ancestry of 0, this resulted in a score of 0. DC and Bermuda stand out as areas which are simultaneously wealthy and have a high percentage of African Ancestry. Outside of America and the Caribbean, the best percentage came in Gabon, which had an GDPPC*AA=$8,411.68.

Here’s the same chart without country labels.
What is the un-admixed African IQ?

If we multiply IQ by ancestry, the IQ of “pure Africans” falls between 78.5 (Gabon) and 63.99 (Ghana). This gives a median value of 71.25.
One way to test how much this IQ is environmentally suppressed would be to compare African immigrants living in Europe or America with the IQ of Africans in Africa. Immigrants are a selected population, but this selection can be controlled for. Once this analysis is performed, a “non-suppressed” IQ of 80 for “pure Africans” is quite reasonable, which is the same as “pure Amerindian” or “pure Indian” IQs.
Assume IQ of 85 for African Americans

If we assume that all African American counties have an IQ of 85, then this produces a straight blue line shooting across our graph.10 However, that the slope of this line is much higher than the red slope (the slope of correlation).

If we exclude the non-American African countries, and just focus on American counties, then we can project forward to simulate what a 100% African population, living in America, would be like.

The resulting IQ of this theoretical “pure African” population (not admixed) living within America would be 81.7. Since we found the median “pure African” IQ in Africa to be 71.25, this implies that the environmental suppression caused by living in Africa is 10.45.11
Do Genes Create the Environment?
Hereditarians object to this analysis, since they maintain that “genes create the environment.”
For example, from PBS:
“We show that there is something about the genetic composition of one’s social group that has a positive influence on the individual,” says Jason Boardman of the University of Colorado Boulder, a study author. “It’s not just your genes, it’s the cumulative influence of your friends’ and classmates’ genes.”
According to Boardman, the most likely explanation for why classmates’ genes influence students’ educational attainment is what researchers call “evocative gene-environment correlation.” For example, certain genes increase the likelihood of children having an irritable temperament, which in turn evokes relatively harsh treatment from their parents. “Their genes create the environment to which they are exposed,” he says.
Hereditarians maintain that, since genes create the environment, placing Africans in America and finding that their IQ is higher than Africans in Africa is “unfair” if we are trying to find the “real IQ” (non-environmentally suppressed).
However, genes interact in complex ways. If there is a population of 50% Africans, and 50% Europeans, and they mix perfectly together, will the population resemble 50% of Africa and 50% of Europe?
Nutritional and Educational Thresholds
Consider a household with a yearly income of $400; now consider a household with a yearly income of $40,000; now consider a household with a yearly income of $400,000.
The first household might have a malnutrition risk of 50%; meaning, children raised in that household have a 50% chance of malnutrition. In the $40,000 household, that will drop to 1%. In the $400,000 house, that will drop to 0.1%. After a certain “threshold” is reached, increases in income do not significantly affect risk of malnutrition.
Similarly, the rate of illiteracy decreases with income with diminishing returns. Illiteracy among children might be 50% for households making $400; 1% for households making $40,000; and 0.1% for households making $400,000. There is a threshold of childhood education, beyond which, IQs only marginally increase.
Theoretically, the problem of malnutrition could be solved by reducing the price of food further (through technological automation or increases in energy production), or by lowering fertility and decreasing the global population significantly (thus lowering demand).
In this case, malnutrition would no longer affect Africa, and this would reduce environmental suppression of IQ — without requiring any “unfair” foreign aid or “unfair” charity. Even if malnutrition does not in itself affect IQ, it can still be a stand-in for other effects: war, pollution, lead poisoning, inbreeding, etc.
One of two things is likely:
Either technology will advance to the point where food/education/pacification is cheaper, thus reducing IQ suppression.
Global fertility will decline, especially in Africa, which will lower demand for goods, making them cheaper.
The inverse case would be that food gets more expensive and fertility increases, which is horrifying, and also unlikely given current trends, barring civilizational collapse.12

Technology and fertility trends both take time, so I do not expect IQ suppression to be solved tomorrow. Additionally, global malnutrition has risen since 2015. However, when we adjust for population growth, then malnutrition has not exceeded 2009 levels — in other words, malnutrition per capita has not increased. Remember, we’re using malnutrition as a measure of and correlate with IQ suppression, not a determinate of it.

From the WEF, current projections for the percentage of people who are malnourished is not expected to grow between 2009 and 2030. This is bad, because ideally, the number would be decreasing, not stagnating. However, 21 years is a relatively short-term trend. If we take into account the speed of the fertility decline, then we should expect malnutrition to eventually decline, even if economic factors (GDP per capita) do not improve.13
Fertility and African Ancestry
Despite the fact that African American fertility is lower than white American fertility, this doesn’t account for the fact that African Americans have a higher rate of abortions. In countries with less access to abortion, this higher fecundity is expressed as increased fertility.

Since African fertility is declining faster than non-African fertility, we should expect the correlation between African ancestry and fertility to decrease over time.

Bermuda pops out as having relatively low fertility, as does South Africa. How does fertility relate to IQ?
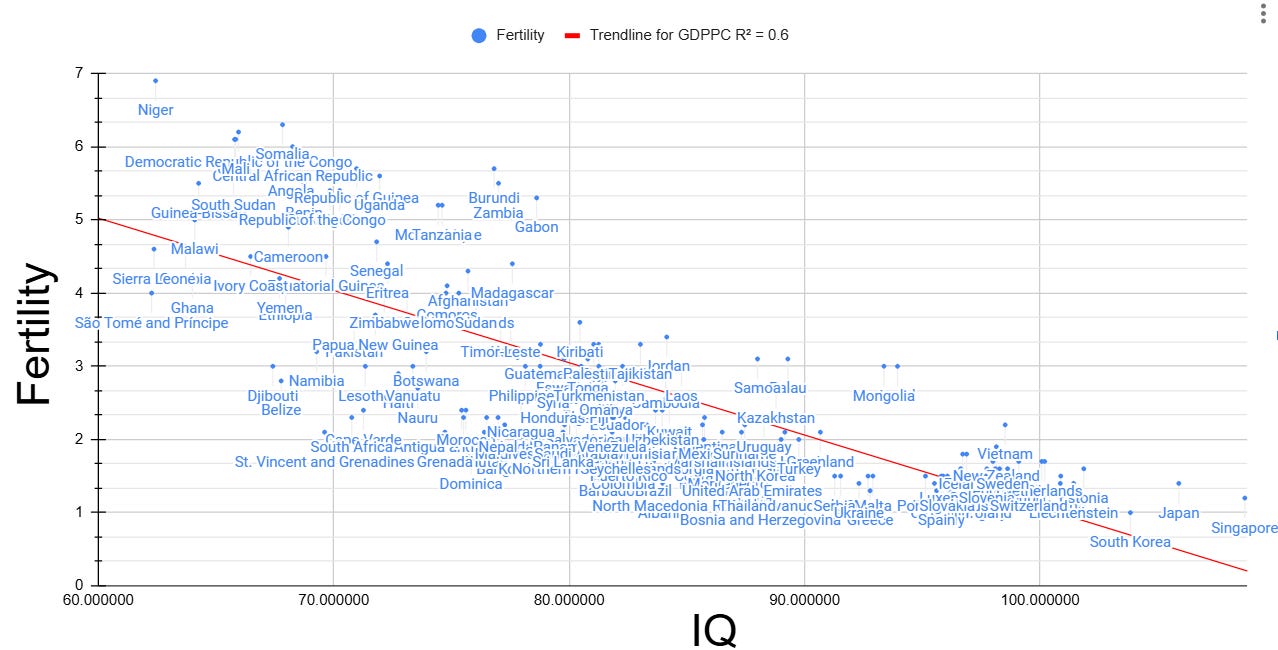
African countries had much higher fertility than would be predicted as a function of IQ. Mongolia is also a strong outlier. If you’re wondering what that dot next to Mongolia is, it’s Israel.
Despite the stereotype that East Asian countries have relatively low fertility, this is not demonstrated when we control for IQ. In fact, Japan has a higher fertility than would be predicted given its IQ.

For example, although Japan has an IQ 22 points higher than Albania, its fertility is roughly the same. We would expect people with an IQ above 115 to have a fertility of 0, but since this is not the case, it seems that as IQ increases, the effect on fertility diminishes. This suggests that low fertility is a unique problem for midwits, and past midwittery (115 IQ) there are no negative effects on fertility. This is reflected in educational data which suggests that those with PhDs have more children than those with Bachelor’s Degrees.
Haiti is the Future: No Wealth Required

Let’s multiply fertility by African ancestry to better see the outliers. I expect African countries to converge toward Haitian fertility. This is because the GDPPC of Haiti is only $1,693, which is in line with African GDPPC. By the end of the century, even if Africa sees no economic growth (or even declines 75%), I still believe the data points toward continued decline of African fertility.

If all African-American counties in America have a TFR of 1.639, this slightly increases the expected fertility, but it is still below a TFR of 3.0, which represents a dramatic decline. One big difference between African-Americans and Africans in Africa is their religiousness and urbanism. Decreasing African fertility, if it occurs, may be largely a result of a decrease in religiousness and increase in urbanism, as well as access to contraception and abortion.
In a future analysis, it might be possible to measure religiousness in each country and plot the relationship between African ancestry and religiousness.
conclusion.
Most racialists have a ladder model of intelligence and wealth. At the top are the Asians; then come the Europeans; then the “Caucasoids” (Arabs, Indians); then the Amerindians; then the Africans.
What I would like to propose in its place is a “twin peaks” model, with NW Europeans and NE Asians as exceptions to the general rule. The average global IQ, excluding those two groups, is 80. The reason for lower IQs observed in Africa (ranging from 62 to 78) is not due to purely genetic factors, but these are at least partially environmentally suppressed.
Of course, IQs could also be suppressed in countries like India as well.
When we look at countries like Yemen, Belize, Ethiopia, Djibouti or Somalia, which are much less African than Ghana or Uganda, we don’t see a regular change in intelligence or wealth. Being half as African doesn’t cut poverty in half, or double intelligence. This suggests that African ancestry is not uniquely detrimental when compared with other ancestries.
My intention here was to put the hysterical claims of white nationalists in context. African ancestry under 10% did not impact wealth or IQ at a national level. African ancestry below 25% still allowed for high income societies. America could easily take in 40 million African immigrants and still be a high income society. That doesn’t mean that it should, just that it could, and civilization would not collapse.
African societies are not uniquely poor or dumb when compared with non-African societies, like India, Papua New Guinea, Venezuela, Algeria, or Belize. These countries struggle with either low intelligence or low GDPPC for geopolitical or environmental reasons.
The problem of low intelligence and poverty is a global problem. Opposition to African immigration conflates poverty, low intelligence, and violence together into a hysterical nightmare of epic proportions. These polemics are not based in reality, but in a kind of inverted fetishization, where black people are imagined as the devil incarnate. In terms of intelligence and wealth, Africa is not an outlier when compared with non-white, non-Asian populations.
Africans may have higher levels of violence than other immigrants, and that could be considered “especially bad.” But if we consider that they have higher birth rates, a natalist might consider that “especially good.”
According to the Danish data, Somalians are not especially violent when compared with Lebanese, Moroccans, or Syrians. This seems more like a cultural problem (religion) than a genetic problem.

Below, I will explain all my research methods, and print my data so you can utilize it if you wish to experiment with it.
How did I Calculate Black Ancestry?
How mixed are so-called “black-identified” people? What is their ancestry?
Most black people outside of Africa are not purely African, with the exception of the Noir Marron:
We find that this population [Noir Marron] has the highest proportion of African ancestry (∼98%) of any African-descendant population analyzed to date, presumably because of centuries of genetic isolation.
Outside of the Noir Marron, the most African population outside of Africa is found in Chocó, Colombia, where the population is roughly 76.0% African descended.

Caveats:
There are a few ways of measuring ancestry:
mtDNA (female line, mother’s mother’s mother…)
Paternal Haplogroup (male line, father’s father’s father…)
autosomal DNA (allele frequency analysis)
Where I found autosomal studies, I used that. When only mtDNA or Haplogroups were available, I used that. For example, in the case of UAE, the mtDNA of 15% is probably higher than the autosomal or paternal haplogroup contribution.14
In some cases, where mtDNA and paternal haplogroup was available, I opted for the higher percentage. This may result in overestimations. In cases where I suspected overestimation due to maternal overrepresentation,15 I adjusted for this by the “barbados factor” of .75.
I did not separate out East Africa ancestry, sometimes called “Cushitic,” from other variants of west-African (Bantu) Sub-Saharan ancestry. This lack of differentiation could be a weakness in the analysis.
Randomly Sourced from Wikipedia (couldn’t find studies):
Argentina: 0.66% according to Wikipedia.
Australia: 1.3%. Aboriginals were 3.8%.
Austria: 0.438%.
Bahrain: 1.6%.
Belgium: 3.06%.
For countries like Greenland, I assumed 0% African ancestry, and where there were no genetic studies on African ancestry, I assumed 100% African ancestry for SS African countries. If this post is popular, I will complete a more exhaustive survey.16
Countries where I looked and couldn’t find ANY data or studies:
Lebanon
Europeans:
Contrary to past observations, Sub-Saharan ancestry is detected at <1% in Europe, with the exception of the Canary Islands.17
This includes Italians, Spaniards, and Greeks. White Americans have more black admixture than Europeans, because despite laws against interracial marriage, admixture events still occurred from the 17th century onward, while Europe did not have large populations of black slaves.
Cuba:18
In the total sample, the average European, African and Native American contributions were 72%, 20% and 8%
Saudi Arabia:
Saudi Arabs had only a minority sub-Saharan Africa component (7%)19
UAE:
we found African mitochondrial (mtDNA) haplogroup L in the Emirate with a frequency of ∼15%20
Iraq:21
9.1% of Iraqi haplogroups originate from Sub-Saharan Africa.
Libya:22
The Arabic-speaking Muslims, with ancient Arabic and Berber, represent 90% of the country’s population. Tuaregs, Tebus and other black African groups make up for the rest of the population.
From a study on Tuaregs:
A total of 48% of the mtDNA haplotypes observed in the Tuareg populations could be ascribed to sub-Saharan haplogroups.23
As a result, Libyans can be estimated as having between 5-10% black ancestry overall.
Algeria:
“The Eurasian component in Algeria reached 80% for mtDNA and 90% for Y-chromosome.”24 I’m going to assume African ancestry of 15%.
Zanzibar:
I found this study25 showing that non-African ancestry accounted for 17% to 51% of the ancestry in three east African populations. Going with 17% to be safe.
Fulani:
the Fulani from Ziniaré in Burkina Faso have ancestry fractions of 74.5% West African, 21.4% European and 4.1% East African origin at K = 3.26
Fulani exist in the following countries:

The Fulani deserve their own article. They have much higher levels of lactose tolerance than other SS Africans, with lighter skin. They have similar levels of non-African ancestry as African Americans.
Tutsi:

Despite the Tutsi being more dolichocephalic than the Hutu and other Bantu populations, I was unable to find evidence of Somali-type Eurasian admixture within their population. The Tutsi phenotypic distinction seems to have arisen from native African phenotypic diversity, rather than as a result of back-migration from Eurasia. There is some discussion by Razib Khan of neolithic “Cushitic” ancestry, but I am not sure if this refers to a Eurasian population, or a SS African population. Although Paul Kagame is lauded by internet racists, his country, at $1,000 GDPPC, is not richer than its Bantu neighbors, and it IQ, at 74.8, is not higher than its Bantu neighbors.
Uganda:27
we find that gene flow from Eurasian populations into Ugandans is necessary to explain the observed frequency spectra. Overall, a dual model of admixture (~7% admixture) and ancient structure outperformed other models
Bolivia:
Only 1.5% of the profiles have Sub-Saharan mtDNA ancestry.28
Belize:
According to 23andme, Belize is 40% African.29
Peru:
These Peruvian localities associated with a partial genomic ancestry derived from Europe, Middle East and Central Asia also present small genomic ancestry proportions from Africa (<3.4%).30
Venezuela:31
A mistura gênica estimada, considerando os marcadores microssatélites, foi de 11% para a parental ameríndia, 21% para a parental africana e de 68% para a parental européia.
Nicaragua:
Admixture proportions based on autosomal STRs show a predominantly Spanish contribution (69%), followed by 20.3% African and 10.6% Amerindian to the genetic pool of Nicaraguan Mestizos.32
This figure includes North Africans (Arabs, from Spaniard admixture) together with sub-Saharan Africans. For Haplogroups, the SS groups were:
L0a (0.61%), L1b (0.61%), L1c (1.84%), L2a (1.22%), L3e (1.22%), and L3h (1.84%)
For a total of 7.34%.
Guatemala:33
when four or more clusters were evaluated (K ≥ 4), we observed an African component, ranging from 2.8% to 0.6% in Ladinos and Kakchiquel, respectively
Caribbean blacks:
Barbadians had 77.4% African ancestry, with an estimated 15.9% European and 6.7% Asian ancestry.34
Accordingly, Barbados isn’t 92.4% African descended, as reported, but only 71.5% African descended, genetically speaking. It’s hard to find genetic studies for smaller Caribbean Islands, where the population is only 50,000 or so. I’m going to assume that all Caribbean blacks are only 77.4% black, in the absence of further evidence.
African Americans:35
This analysis showed AAs on average were 72.5% African, 19.6% European and 8% Asian, while ACs were 77.4% African, 15.9% European, and 6.7% Asian which were significantly different.
Ethiopians and Yemenis:
According to this paper,36
Approximately one-half of both Ethiopian (52.2%) and Yemeni (45.7%) mtDNA lineages belonged to clades specific to sub-Saharan Africa
Mitochondrial DNA isn’t the same thing as total genetic ancestry, since it is passed on by the mother. However, the assumption in most models of immigration from Eurasia to Africa is that it was males who left the Middle East and entered into Africa. So the fact that the female line is only 45%-52% African indicates that total ancestry would be less African, since the male component would be less African than the female component. Therefore, 52% is likely an overestimation in the case of Ethiopia. But I’ll use it anyway, in the absence of other evidence.
Oman:
Unable to find data on Oman, I estimated Oman as between Saudi Arabia and Yemen, at 26.35%.
Moroccans:
As expected, the impact of the sub-Saharan ancestral gene pool on Moroccan Berber genomes is by far stronger than that found in southern Iberians, 13.80 ± 3.41% versus 1.41 ± 0.72%, respectively.
Aruba:
As much as 18.8% of Haplogroups can be traced to Africans, but this is likely an overestimation.

Puerto Rico:
Average ancestry values for the Puerto Rican population were 15.2% (±7.2), 21.2% (±14.4), and 63.7% (±15.2) for the Native American, African, and European contributions, respectively37
Seychelles:38
The African ancestry was shown to be about 67% and the main gene flow from Africa was mainland Bantu speakers.
Brazil:39
The weighted mean proportions of European, African, and Native American ancestries were 68.1%, 19.6%, and 11.6%, respectively.
Haiti:40
Haitians… showed the largest average proportion of West African ancestry (84%).
Colombia:
The country is geographically balkanized:41
At the continental level, Chocó shows mostly African genetic ancestry (76%) with a nearly even split between European (13%) and Native American (11%) fractions, whereas Medellín has primarily European ancestry (75%), followed by Native American (18%) and African (7%).
Mauritians:42
the majority of maternal lineages were derived from South Asia (58.76%), with Malagasy (16.60%), East/Southeast Asian (11.34%) and Sub-Saharan African (10.21%) also making significant contributions.
Dominican (Republic):43
In modern days and according to genealogical DNA testing, the genetic makeup of the Dominican population is estimated to be 52% European, 40% Sub‐Saharan African, and 8% Native American‐Taino
Dominica (not a Republic?):44
The only study I found was on rural people from Dominica, which showed a median of 57% African ancestry.
Chile:
Weighted mean American, European and African genetic contributions of 44.34% ± 3 9%, 51.85% ± 5.44% and 3.81% ± 0.45%, were estimated.45
Ecuador:
Here’s a surprising result: self-identified “afro-Ecuadorians” were only 49.53% African.46 They are 3.36% of the total population, which results in an adjusted total ancestry of 1.66%.
Jamaica:47
European genetic ancestry [within self-identified blacks] ranged from 6.8% (Jamaica) to 22.5% (New Orleans).
Equatorial Guinea:48
Altogether, the proportion of recent Eurasian admixture found in our sample is approximately 15%, which is easily explained by the well-reported European arrivals to this territory within the last five centuries.
Cape Verde (Cabo Verde):49
Among the Cabo Verdean, ASW, and ACB populations, ACB individuals show, on average, the highest membership to the orange ‘African’ cluster (88.23%, SD = 7.33%), followed by the ASW (78.00%, SD = 10.88%), and Cabo Verdeans (59.01%, SD = 11.97%).
Djibouti:
I couldn’t find data on the Afar, but assuming they mirror the Somali, then the country is 57% African descended.
Somali:50
Principal component analysis with PLINK software showed approximately 60% East African and 40% West Eurasian genes in the Somali population
São Tomé and Príncipe:
While most male lineages belonged to sub-Saharan haplogroups, the component of European origin added up 23.9% in the archipelago.51
Angola (special case!):
Ovimbundu 37%, Kimbundu 25%, Bakongo 13%, Mestico (mixed European and native African) 2%, European 1%
Things get complicated, because “Ovimbundu are considered a part of the Mbundu people.”
This study52 showed that 11% of Bakongo people have Haplogroup R. Again, this does correspond to direct ancestry, but it is remarkable, since that is much higher than many populations in North Africa. How did they get there? It suggests either recent admixture, or some secret ancient colonization of the west coast of Africa, thousands of years ago.
The total R Haplogroup ancestry among black Angolans is between 2.3% and 3.78%. This in addition to the 3% of the population which is European or Chinese. In total, the African ancestry of Angolans is perhaps as low as 93%.
Eritrea:
STRUCTURE analysis showed that the Tigray population is characterized by a strong (∼50 %) non-African genetic component shared with European and Middle Eastern populations.53
Tigrayans are 55% of the population, so in the absence of detailed analysis of every single ethnicity in Eritrea, I estimate non-African admixture at 27.5%. This is an underestimate. I gave it the “Barbados adjustment” to bring it in line with its neighbors, Djibouti and Somalia.54
Egypt:55
Egyptians have a Middle Eastern, a European/Eurasian, a North African and an East African component with 27%, 24%, 15% and 9% relative influence, respectively
Tunisia:56
Global comparative analysis highlighted the heterogeneity of Tunisian populations, among which, as a whole, dominated a set of lineages ascribed to be of autochthonous Berber origin (71.67%), beside a component of essentially Middle Eastern extraction (18.35%), and signatures of Sub-Saharan (5.2%), European (3.45%) and Asiatic (1.33%) contributions.
Ivory Coast:
96% African ancestry. Didn’t find a source on this, so this is just a rumor. Better than nothing.
Comoros:
The [African] haplogroups L0, L1, L2 and L3′4(xMN) compose 84.7% of the mitochondria in the Comoros sample57
Kenya:58
Following demographic studies for Kenyan and Ethiopian athletes, we selected the Kalenjin (K, n = 100) and the Oromo (O, n = 26) as the focal populations in this study. These populations have differing levels of Eurasian ancestry (7.3–10.99% for Kalenjin, 43.62–50.82% for Oromo).
The population of Kalenjin is 6,358,113, and Oromo is 739,839. This is out of a total population of 55.1 million. These two tribes make up 12.88% of Kenyans. Using the lower bound of 10.99% Eurasian, this gives a total national admixture of 1.42%.
Eswati:59
Eswati a tiny land-locked country within South Africa. The estimates for non-Africans I found were: Indian 0.8%, Pakistani 0.8%, Portuguese 0.5%, for a total of 2.1% non-African. I was unable to find genetic studies on admixture.
Madagascar:
the Malagasy genetic diversity is best described as a mixture of 68% African genomic components and 32% Asian components60
Data:
Substack doesn’t let me post charts or tables, which is unfortunate. However, if you paste this into ChatGPT, and ask it to print it in table form, you should then be able to print this into excel and mess around with it.
Name	ancestry	adjusted	GDPPC	IQ	Fertility
Afghanistan	0.00%	0.00%	563.9	75.700000	4.3
Albania	0.00%	0.00%	5,856.40	83.977570	1.4
Algeria	15.00%	15.00%	4,429.10	80.658440	2.7
American Samoa	0.00%	0.00%	16,632.10	#N/A	2.8
Andorra	0.00%	0.00%	46,494.30	#N/A	1.4
Angola	93.00%	93.00%	$2,310	68.184620	5.8
Anguilla	85.30%	66.02%	$35,374	#N/A	2.1
Antigua and Barbuda	87.30%	67.57%	$21,560	75.512610	2.3
Argentina	0.00%	0.00%	9,277.60	85.749740	2.3
Armenia	0.66%	0.66%	4,621.50	88.632930	1.7
Aruba	18.80%	14.55%	$33,301	#N/A	1.9
Australia	1.30%	1.30%	69,858.70	98.622320	1.6
Austria	0.44%	0.44%	58,019.00	98.261100	1.5
Azerbaijan	0.00%	0.00%	5,625.60	85.717420	2
Bahrain	1.60%	1.60%	53,477.00	87.318460	2.1
Bangladesh	0.00%	0.00%	2,532.20	77.711620	2
Barbados	92.40%	71.52%	$22,672	81.761180	1.7
Belarus	0.00%	0.00%	7,396.40	95.803180	1.5
Belgium	3.06%	3.06%	58,016.10	98.106230	1.6
Belize	42.60%	32.97%	$7,988	67.765900	2.8
Benin	97.81%	97.81%	1,327.40	68.738420	5.5
Bermuda	52.00%	40.25%	$123,091	89.502370	1.5
Bhutan	0.00%	0.00%	3,719.60	76.396280	2.1
Bolivia	1.50%	1.50%	4,421.30	81.379580	2.8
Bosnia and Herzegovina	0.00%	0.00%	5,523.50	88.127020	1.3
Botswana	93.00%	93.00%	$7,250	73.930140	3.2
Brazil	19.60%	19.60%	$10,044	83.579760	1.7
British Virgin Islands	76.90%	59.52%	42,026.50	#N/A	1.9
Brunei	0.00%	0.00%	83,134.20	85.568280	1.8
Bulgaria	0.00%	0.00%	9,494.60	91.528440	1.5
Burkina Faso	97.86%	97.86%	857.9	69.838340	5.4
Burundi	100.00%	100.00%	322.1	76.810730	5.7
Cambodia	0.00%	0.00%	1,574.10	84.100000	2.9
Cameroon	96.58%	96.58%	1,588.10	68.070710	4.9
Canada	4.30%	3.33%	52,039.60	100.880000	1.5
Cape Verde	59.01%	59.01%	$4,322	71.260000	2.4
Cayman Islands	30.20%	23.37%	75,070.40	#N/A	1.9
Central African Republic	98.85%	98.85%	478.7	68.252150	6
Chad	99.54%	99.54%	834	65.784620	6.1
Channel Islands	0.00%	0.00%	109,314.50	#N/A	1.8
Chile	3.81%	3.81%	15,466.70	88.287330	1.9
China	0.00%	0.00%	13,204.20	100.200000	1.7
Chocó, Colombia	76.00%	76.00%	$2,830	#N/A
Colombia	11.00%	11.00%	$6,980	82.304710	1.8
Comoros	84.70%	84.70%	$1,587	74.813620	4.1
Cook Islands	0.00%	0.00%	17,957.90	89.160000	2.1
Costa Rica	8.00%	5.80%	$16,595	85.984680	1.9
Croatia	0.00%	0.00%	14,131.00	95.515620	1.4
Cuba	20.00%	20.00%	9,051.30	87.900000	1.6
Curaçao	85.00%	65.79%	$20,493	#N/A	1.9
Cyprus	0.00%	0.00%	30,010.50	92.695650	1.5
Czech Republic	0.00%	0.00%	26,540.00	98.281210	1.6
Democratic Republic of the Congo	100.00%	100.00%	559.7	65.953860	6.2
Denmark	5.04%	3.90%	79,279.90	98.000480	1.7
Djibouti	57.00%	57.00%	$3,606	67.412560	3
Dominica	57.00%	57.00%	13,089.00	75.835000	1.8
Dominican Republic	40.00%	40.00%	$10,716	82.410000	2.4
Ecuador	3.36%	1.66%	6,136.30	82.040000	2.6
Egypt	9.00%	9.00%	4,463.60	81.255000	3.3
El Salvador	0.16%	0.16%	4,090.90	79.870000	2.4
Equatorial Guinea	85.00%	85.00%	$7,067	69.667000	4.5
Eritrea	72.50%	56.12%	707.7	72.282680	4.4
Estonia	0.00%	0.00%	28,476.50	101.860000	1.6
Eswatini	97.90%	97.90%	$3,797	79.781340	3.1
Ethiopia	52.20%	52.20%	$1,294	67.949870	4.1
European Union	2.45%	1.78%	$56,034	#N/A	1.5
Faroe Islands	0.00%	0.00%	86,646.20	#N/A
Fiji	0.00%	0.00%	6,743.70	81.270750	2.7
Finland	1.10%	0.80%	61,224.20	100.860000	1.4
France	7.33%	5.32%	$44,461	96.882650	1.8
French Polynesia	0.00%	0.00%	21,732.50	#N/A	2.2
Gabon	99.90%	99.90%	$8,420	78.616460	5.3
Gambia	95.36%	95.36%	1,364.40	63.700000	4.6
Georgia	33.20%	24.07%	$78,754	85.044880	2
Germany	1.20%	1.20%	54,952.60	98.542900	1.5
Ghana	100.00%	100.00%	2,355.50	63.989640	4.2
Greece	2.00%	1.45%	26,494.90	92.782800	1.3
Greenland	0.00%	0.00%	54,237.20	90.669790	2.1
Grenada	82.40%	63.78%	$10,464	74.720050	2.1
Guam	30.00%	21.75%	23,181.10	#N/A	2.1
Guatemala	2.80%	2.03%	5,042.60	78.780000	3.3
Guinea-Bissau	92.35%	92.35%	649.3	64.260000	5.5
Guyana	30.00%	21.75%	10,345.70	75.430810	2.4
Haiti	95.00%	95.00%	877.3	72.740000	2.9
Honduras	2.00%	1.45%	2,758.20	79.300000	2.7
Hong Kong	0.00%	0.00%	63,794.40	#N/A	1.2
Hungary	0.00%	0.00%	17,535.00	97.405080	1.4
Iceland	1.00%	0.73%	80,139.50	96.715450	1.8
India	0.00%	0.00%	$2,485	76.494420	2.3
Indonesia	0.00%	0.00%	4,712.50	81.896000	2.3
Iran	0.00%	0.00%	4,250.10	83.930700	2
Iraq	9.10%	9.10%	5,544.40	82.268800	3
Ireland	1.50%	1.09%	114,592.00	99.100000	1.7
Isle of Man	0.10%	0.07%	118,314.30	#N/A	1.9
Israel	1.73%	1.25%	49,538.20	93.947380	3
Italy	2.00%	1.45%	34,073.30	96.210240	1.3
Ivory Coast	96.00%	96.00%	$2,729	66.468490	4.5
Jamaica	76.30%	71.11%	$6,874	79.800000	2.2
Japan	0.00%	0.00%	41,637.30	105.897000	1.4
Jordan	0.00%	0.00%	4,601.70	84.142240	3.4
Kazakhstan	0.00%	0.00%	9,831.90	88.786590	2.7
Kenya	1.42%	1.42%	1,804.40	77.515510	3.6
Kiribati	0.00%	0.00%	2,005.40	80.453530	3.6
Kosovo	0.00%	0.00%	4,584.90	78.036640	2
Kuwait	1.00%	0.73%	74,748.40	84.260000	2.5
Kyrgyzstan	0.00%	0.00%	1,658.30	80.510000	3
Laos	0.00%	0.00%	2,818.30	84.770000	3
Latvia	0.00%	0.00%	30,217.60	96.767770	1.5
Lebanon	0.00%	0.00%	9,019.70	81.823870	2.1
Lesotho	99.00%	99.00%	1,124.40	71.340560	3
Liberia	100.00%	100.00%	1,702.10	67.283940
Libya	10.00%	4.80%	8,020.30	81.957460	2.8
Liechtenstein	0.10%	0.07%	186,042.10	101.427910	1.4
Lithuania	0.00%	0.00%	23,104.50	95.886600	1.5
Loíza County, Puerto Rico	31.79%	24.61%	$4,707	#N/A
Luxembourg	2.00%	1.45%	133,633.60	96.631980	1.6
Macau	0.00%	0.00%	70,323.90	#N/A	1.2
Madagascar	68.00%	68.00%	1,496.50	77.585580	4.4
Malawi	100.00%	100.00%	553.6	64.089680	5
Malaysia	0.00%	0.00%	11,034.90	89.000690	2
Maldives	0.00%	0.00%	16,580.40	77.260000	2.2
Mali	96.61%	96.61%	945.9	65.835210	6.1
Malta	0.00%	0.00%	32,028.50	92.899530	1.5
Marshall Islands	0.00%	0.00%	4,647.90	86.500000	2.1
Mauritania	95.33%	95.33%	4,417.50	73.112430	4
Mauritius	10.21%	10.21%	$11,417	86.834610	1.7
Medellín, Colombia	7.00%	5.08%	$17,600	#N/A
Mexico	3.00%	2.32%	$13,926	85.663270	2.2
Micronesia	0.00%	0.00%	3,454.50	#N/A	3
Moldova	0.00%	0.00%	4,400.90	88.132620	1.5
Monaco	0.00%	0.00%	190,695.20	#N/A	1.6
Mongolia	0.00%	0.00%	5,007.70	93.370000	3
Montenegro	0.00%	0.00%	8,380.00	86.748840	1.8
Montserrat	86.20%	66.72%	$16,858	#N/A	1.8
Morocco	13.80%	10.68%	$3,672	75.612890	2.4
Mozambique	99.03%	99.03%	577.3	74.436180	5.2
Myanmar	0.00%	0.00%	1,242.00	83.232170	2.2
Namibia	96.66%	96.66%	$4,743	69.271550	3.2
Nauru	0.00%	0.00%	9,614.70	73.569450	2.7
Nepal	0.00%	0.00%	1,241.40	76.977700	2.3
Netherlands	7.00%	5.08%	58,419.00	100.078000	1.7
New Caledonia	2.00%	1.45%	35,332.00	#N/A	2.3
New Zealand	0.30%	0.22%	42,083.30	98.146560	1.9
Nicaragua	7.34%	7.34%	2,463.60	77.947000	2.5
Niger	98.34%	98.34%	735.7	62.432080	6.9
Nigeria	98.32%	98.32%	2,068.50	70.254710	5.4
North Korea	0.00%	0.00%	1,300.00	87.900000	1.9
North Macedonia	0.00%	0.00%	6,505.70	83.436190	1.5
Northern Mariana Islands	0.00%	0.00%	24,265.70	81.160000	2
Norway	2.70%	1.96%	107,787.10	97.397310	1.5
Oman	26.35%	26.35%	20,234.90	81.273110	2.8
Pakistan	0.00%	0.00%	1,736.70	70.864440	3.6
Palau	0.00%	0.00%	17,042.20	89.287010	3.1
Palestine	0.00%	0.00%	4,694.20	81.042230	3.3
Panama	30.00%	21.75%	14,853.90	79.652150	2.3
Papua New Guinea	0.00%	0.00%	3,982.50	71.766600	3.7
Paraguay	2.00%	1.45%	4,748.30	78.765180	3
Peru	3.40%	2.47%	7,003.60	82.371790	2.3
Philippines	0.00%	0.00%	3,792.50	78.139210	3
Poland	0.00%	0.00%	19,606.70	97.817980	1.4
Portugal	4.00%	2.90%	24,352.40	95.134470	1.5
Puerto Rico	21.20%	15.37%	$36,779	82.524600	1.9
Qatar	1.00%	0.73%	68,726.90	83.667120	2.4
Republic of Guinea	91.48%	91.48%	1,107.50	70.967850	5.7
Republic of the Congo	100.00%	100.00%	2,469.40	69.086490	5.4
Romania	0.00%	0.00%	15,702.50	87.337500	1.5
Russia	0.00%	0.00%	11,230.00	97.690360	1.5
Rwanda	100.00%	100.00%	1,412.10	74.762520	4
Saint Kitts and Nevis	92.50%	67.06%	$22,553	#N/A
Saint Lucia	85.30%	66.02%	$13,980	#N/A
Saint Martin (French part)	90.00%	65.25%	38,232.90	#N/A	2
Samoa	0.00%	0.00%	7,609.50	88.000000	3.1
San Marino	0.10%	0.07%	92,126.90	#N/A	1.6
São Tomé and Príncipe	76.10%	76.10%	$2,602	62.260000	4
Saudi Arabia	10.00%	7.25%	$28,895	80.304920	2.2
Senegal	92.99%	92.99%	2,138.90	71.820680	4.7
Serbia	0.00%	0.00%	7,837.60	91.275370	1.5
Seychelles	67.00%	67.00%	$17,879	81.973210	2
Sierra Leone	98.73%	98.73%	484.6	62.362890	4.6
Singapore	0.00%	0.00%	103,181.50	108.700000	1.2
Sint Maarten (Dutch part)	90.00%	65.25%	23,804.20	#N/A	2.1
Slovakia	0.00%	0.00%	27,108.50	96.067270	1.5
Slovenia	0.00%	0.00%	28,592.70	97.743770	1.6
Solomon Islands	0.00%	0.00%	3,401.30	75.310680	4
Somalia	60.00%	60.00%	$644	67.823190	6.3
South Africa	81.00%	81.00%	$6,253	70.763810	2.3
South Korea	0.00%	0.00%	41,401.40	103.840000	1
South Sudan	100.00%	100.00%	711.1	65.740460	5.6
Spain	0.76%	0.55%	37,876.10	95.608330	1.3
Sri Lanka	0.00%	0.00%	4,267.00	79.738770	2.1
St. Vincent and Grenadines	66.00%	51.08%	$10,279	69.609530	2.1
Sudan	30.00%	23.12%	$2,272	76.042850	4
Suriname	37.40%	28.95%	$6,069	87.460000	2.2
Sweden	2.38%	1.73%	58,267.60	98.408670	1.8
Switzerland	1.39%	1.01%	93,155.10	99.526250	1.5
Syria	0.00%	0.00%	1,277.60	79.319040	2.9
Tajikistan	0.00%	0.00%	1,002.30	83.025660	3.3
Tanzania	99.00%	71.78%	1,066.30	74.602940	5.2
Thailand	0.00%	0.00%	6,467.10	87.556100	1.5
The Bahamas	92.70%	71.75%	$34,750	81.550140
Timor-Leste	0.00%	0.00%	2,581.90	77.081360	3.6
Togo	99.69%	99.69%	694.1	70.533870
Tonga	0.00%	0.00%	4,774.00	80.789730	3.1
Trinidad and Tobago	34.20%	24.80%	$18,333	87.010910
Tunisia	5.20%	5.20%	4,289.40	83.297710	2.2
Turkey	1.76%	1.27%	11,689.70	89.754370	2
Turkmenistan	0.00%	0.00%	7,042.50	81.260000	3
Turks and Caicos Islands	87.00%	71.52%	$30,438	#N/A	2
Tuvalu	0.00%	0.00%	4,836.70	#N/A	3.1
Uganda	93.00%	93.00%	1,113.20	71.948150	5.6
Ukraine	0.00%	0.00%	3,527.30	92.308480	1.4
United Arab Emirates	15.00%	10.88%	89,438.70	87.773200	1.7
United Kingdom	3.70%	2.68%	$48,867	99.079980
United States	14.40%	10.44%	$81,695	97.682210
Uruguay	8.00%	5.80%	18,659.20	88.276240	2.3
USA, Adams County, Mississippi	56.83%	41.20%	$23,482	85.000000	1.639
USA, Alabama	26.60%	19.29%	$61,846	85.000000	1.639
USA, Allendale County, South Carolina	70.36%	51.01%	$15,120	85.000000	1.639
USA, Baltimore City County, Maryland	57.79%	41.90%	$34,371	85.000000	1.639
USA, Bamberg County, South Carolina	58.32%	42.28%	$19,732	85.000000	1.639
USA, Bertie County, North Carolina	59.77%	43.33%	$20,994	85.000000	1.639
USA, Bibb County, Georgia	54.58%	39.57%	$26,187	85.000000	1.639
USA, Bolivar County, Mississippi	62.50%	45.31%	$19,689	85.000000	1.639
USA, Brunswick County, Virginia	54.31%	39.37%	$23,699	85.000000	1.639
USA, Bullock County, Alabama	71.41%	51.77%	$18,087	85.000000	1.639
USA, Caddo County, Louisiana	48.48%	35.15%	$26,404	85.000000	1.639
USA, Calhoun County, Georgia	64.26%	46.59%	$17,799	85.000000	1.639
USA, Charles County, Maryland	49.24%	35.70%	$44,865	85.000000	1.639
USA, Chicot County, Arkansas	53.07%	38.48%	$20,294	85.000000	1.639
USA, Claiborne, Mississippi	87.45%	63.40%	$16,642	85.000000	1.639
USA, Clay County, Georgia	56.07%	40.65%	$15,848	85.000000	1.639
USA, Clay County, Mississippi	57.97%	42.03%	$21,982	85.000000	1.639
USA, Clayton County, Georgia	69.89%	50.67%	$24,932	85.000000	1.639
USA, Coahoma County, Mississippi	76.12%	55.19%	$20,489	85.000000	1.639
USA, Copiah County, Mississippi	50.56%	36.66%	$21,993	85.000000	1.639
USA, Crittenden County, Arkansas	53.79%	39.00%	$22,905	85.000000	1.639
USA, Dallas County, Alabama	69.94%	50.71%	$20,627	85.000000	1.639
USA, Danville County, Virginia	51.37%	37.24%	$26,298	85.000000	1.639
USA, DeKalb County, Georgia	50.89%	36.90%	$35,802	85.000000	1.639
USA, Delaware	24.10%	17.47%	$98,055	85.000000	1.639
USA, Dominica (Not to be confused with the Dominican Republic)	75.00%	58.05%	$8,954	85.000000	1.639
USA, Dooly County, Georgia	49.62%	35.97%	$19,128	85.000000	1.639
USA, Dougherty County, Georgia	69.92%	50.69%	$23,055	85.000000	1.639
USA, Douglas County, Georgia	48.44%	35.12%	$33,371	85.000000	1.639
USA, Early County, Georgia	51.24%	37.15%	$20,514	85.000000	1.639
USA, East Carroll County, Louisiana	69.55%	50.42%	$17,984	85.000000	1.639
USA, Edgecombe County, North Carolina	56.09%	40.67%	$21,782	85.000000	1.639
USA, Emporia County, Virginia	63.39%	45.96%	$23,315	85.000000	1.639
USA, Fairfield County, South Carolina	53.71%	38.94%	$23,245	85.000000	1.639
USA, Franklin County, Virginia	56.71%	41.11%	$30,326	85.000000	1.639
USA, Gadsden County, Florida	53.47%	38.77%	$22,183	85.000000	1.639
USA, Greene County, Alabama	80.80%	58.58%	$20,357	85.000000	1.639
USA, Greensville County, Virginia	58.44%	42.37%	$21,492	85.000000	1.639
USA, Hale County, Alabama	56.39%	40.88%	$22,721	85.000000	1.639
USA, Halifax County, North Carolina	51.10%	37.05%	$22,144	85.000000	1.639
USA, Hampton County, South Carolina	51.68%	37.47%	$20,661	85.000000	1.639
USA, Hampton County, Virginia	49.52%	35.90%	$33,772	85.000000	1.639
USA, Hancock County, Georgia	69.01%	50.03%	$17,292	85.000000	1.639
USA, Haywood County, Tennessee	50.56%	36.66%	$22,879	85.000000	1.639
USA, Henry County, Georgia	49.07%	35.58%	$32,209	85.000000	1.639
USA, Hertford County, North Carolina	57.50%	41.69%	$21,222	85.000000	1.639
USA, Hinds County, Mississippi	69.43%	50.34%	$25,256	85.000000	1.639
USA, Holmes County, Mississippi	83.86%	60.80%	$15,199	85.000000	1.639
USA, Humphreys County, Mississippi	78.48%	56.90%	$15,199	85.000000	1.639
USA, Issaquena County, Mississippi	56.58%	41.02%	$19,237	85.000000	1.639
USA, Jasper County, Mississippi	50.96%	36.95%	$20,055	85.000000	1.639
USA, Jefferson County, Arkansas	56.25%	40.78%	$23,333	85.000000	1.639
USA, Jefferson County, Georgia	50.77%	36.81%	$20,714	85.000000	1.639
USA, Jefferson County, Mississippi	85.28%	61.83%	$16,350	85.000000	1.639
USA, Jefferson Davis County, Mississippi	58.68%	42.54%	$18,229	85.000000	1.639
USA, Kemper County, Mississippi	61.14%	44.33%	$19,933	85.000000	1.639
USA, Lee County, Arkansas	54.22%	39.31%	$17,728	85.000000	1.639
USA, Lee County, South Carolina	61.00%	44.23%	$18,551	85.000000	1.639
USA, Leflore County, Mississippi	73.73%	53.45%	$20,436	85.000000	1.639
USA, Louisiana	32.60%	23.64%	$71,642	85.000000	1.639
USA, Lowndes County, Alabama	69.75%	50.57%	$19,240	85.000000	1.639
USA, Macon County, Alabama	79.05%	57.31%	$22,170	85.000000	1.639
USA, Macon County, Georgia	59.29%	42.99%	$19,220	85.000000	1.639
USA, Madison County, Louisiana	62.13%	45.04%	$17,548	85.000000	1.639
USA, Marengo County, Alabama	52.72%	38.22%	$23,043	85.000000	1.639
USA, Marion County, South Carolina	56.21%	40.75%	$21,443	85.000000	1.639
USA, Marlboro County, South Carolina	50.22%	36.41%	$19,191	85.000000	1.639
USA, Maryland	31.60%	22.91%	$87,021	85.000000	1.639
USA, Mississippi	37.80%	27.41%	$53,061	85.000000	1.639
USA, Montgomery County, Alabama	56.98%	41.31%	$26,770	85.000000	1.639
USA, North Carolina	22.10%	16.02%	$75,876	85.000000	1.639
USA, Northampton County, North Carolina	55.46%	40.21%	$21,373	85.000000	1.639
USA, Noxubee County, Mississippi	70.27%	50.95%	$18,563	85.000000	1.639
USA, Orangeburg County, South Carolina	60.61%	43.94%	$22,327	85.000000	1.639
USA, Orleans County, Louisiana	54.24%	39.32%	$34,296	85.000000	1.639
USA, Perry County, Alabama	69.75%	50.57%	$19,210	85.000000	1.639
USA, Petersburg County, Virginia	74.16%	53.77%	$25,195	85.000000	1.639
USA, Phillips County, Arkansas	62.43%	45.26%	$20,075	85.000000	1.639
USA, Pike County, Mississippi	53.47%	38.77%	$21,583	85.000000	1.639
USA, Portsmouth County, Virginia	53.33%	38.66%	$31,277	85.000000	1.639
USA, Prince George's County, Maryland	59.83%	43.38%	$40,807	85.000000	1.639
USA, Quitman County, Mississippi	73.61%	53.37%	$16,294	85.000000	1.639
USA, Randolph County, Georgia	60.34%	43.75%	$18,696	85.000000	1.639
USA, Richmond County, Georgia	55.27%	40.07%	$26,850	85.000000	1.639
USA, Rockdale County, Georgia	58.15%	42.16%	$30,922	85.000000	1.639
USA, Sharkey County, Mississippi	70.76%	51.30%	$19,691	85.000000	1.639
USA, Shelby County, Tennessee	51.34%	37.22%	$30,656	85.000000	1.639
USA, South Carolina	26.00%	18.85%	$63,711	85.000000	1.639
USA, St. Francis County, Arkansas	54.40%	39.44%	$20,055	85.000000	1.639
USA, St. Helena County, Louisiana	53.67%	38.91%	$20,423	85.000000	1.639
USA, St. John the Baptist County, Louisiana	57.22%	41.48%	$26,031	85.000000	1.639
USA, Sumter County, Alabama	72.88%	52.84%	$19,985	85.000000	1.639
USA, Sumter County, Georgia	51.05%	37.01%	$21,691	85.000000	1.639
USA, Sunflower County, Mississippi	69.94%	50.71%	$17,546	85.000000	1.639
USA, Sussex County, Virginia	53.38%	38.70%	$25,258	85.000000	1.639
USA, Talbot County, Georgia	53.71%	38.94%	$20,056	85.000000	1.639
USA, Taliaferro County, Georgia	53.43%	38.74%	$16,429	85.000000	1.639
USA, Tallahatchie County, Mississippi	58.62%	42.50%	$17,857	85.000000	1.639
USA, Tensas County, Louisiana	54.26%	39.34%	$17,870	85.000000	1.639
USA, Terrell County, Georgia	60.59%	43.93%	$21,490	85.000000	1.639
USA, Tunica County, Mississippi	77.27%	56.02%	$23,759	85.000000	1.639
USA, Vance County, North Carolina	49.88%	36.16%	$22,604	85.000000	1.639
USA, Virgin Islands	71.40%	51.77%	$41,976	85.000000	1.639
USA, Virginia	20.00%	14.50%	$86,747	85.000000	1.639
USA, Warren County, Georgia	58.54%	42.44%	$18,129	85.000000	1.639
USA, Warren County, North Carolina	48.89%	35.45%	$21,719	85.000000	1.639
USA, Washington County, Georgia	53.65%	38.90%	$20,374	85.000000	1.639
USA, Washington County, Mississippi	71.33%	51.71%	$20,892	85.000000	1.639
USA, Washington County, North Carolina	48.85%	35.42%	$21,816	85.000000	1.639
USA, Washington DC	44.40%	32.19%	$263,220	85.000000	1.639
USA, Wilcox County, Alabama	70.59%	51.18%	$16,142	85.000000	1.639
USA, Wilkinson County, Mississippi	67.39%	48.86%	$21,268	85.000000	1.639
USA, Williamsburg County, South Carolina	63.39%	45.96%	$19,501	85.000000	1.639
USA, Yazoo County, Mississippi	59.57%	43.19%	$21,914	85.000000	1.639
Uzbekistan	0.00%	0.00%	2,383.60	83.952500	2.4
Vanuatu	0.00%	0.00%	4,602.90	73.358050	3
Venezuela	21.00%	21.00%	1,824.00	81.829110	2.3
Vietnam	0.00%	0.00%	3,896.10	98.520000	2.2
Yemen	45.70%	45.70%	$533	67.696260	4.2
Zambia	100.00%	100.00%	1,468.70	76.997600	5.5
Zanzibar	83.00%	83.00%	2,149.30	#N/A	5.3
Zimbabwe 99.40% 99.40% 1,541.30 72.147900 4White supremacists have a special relationship with black people. This is because white supremacy was founded in America, and the American racial experience before 1965 was binary: white and black.
If African ancestry were singularly determinant, this should be reflected in the data. For example, if the “pure African” IQ is 70, and the “non-Asian, non-European” IQ is 90 (Arabs, Turks, or Polynesians for example), then a population which is 50% African and 50% non-African should have an IQ of 80. As I will demonstrate, this finding is not empirically verifiable.
We all know that there are individual Indians and Pakistanis who are very intelligent and capable. If the African environment was improved, we should expect a greater number of African geniuses to emerge than we see from India and Pakistan.
Some race realists argue that race is real because we can distinguish African and European skulls. It is true that Europeans and Indians share a “Caucasoid” skull structure, as well as 10-15% steppe ancestry. However, this skull structure is also shared by Somalians.
The possible exception to this would be Jewish gains in intelligence over the last 2,000 years. Ashkenazi Jews were founded by admixture event with Italian women, followed by “reverse brain drain,” where Jews with lower intelligence assimilated into the surrounding population. It is possible that this founder population began with an IQ of 115 due to selection for mobility and class. This would undermine the claim that Jews have “become more intelligent” due to Rabbinic eugenics or pogroms.
The Saami are representative of Europeans, but they did pick up significant Yamnaya admixture, and should not be taken as “pure” hunter-gatherers. This map estimates it at 16% Yamnaya. As far as European total, “estimates of the relative contribution of each have varied from an equal input to ∼80% Caucasoid and 20% Mongoloid genes.” source: pmc.ncbi.nlm.nih.gov/articles/PMC1181943/
Saami visual spatial IQ was relatively high (91-103), but verbal IQ was measured at 89, 90, and 96 in the 1970s: sciencedirect.com/science/article/abs/pii/S0160289614000427
I use the term “African” to refer to “sub-Saharan African” in this article.
So if two countries have 0% African ancestry, we only display the GDPPC which is highest.
In reality, these counties probably have IQs higher than 85, because whites and Hispanics live in them too. So I’m actually underestimating here — these black plurality counties probably have IQs closer to 90 or even 95. I believe there is county-level data on IQ which would make this data more robust. However, using 85 as a lower bound does show that American counties significantly overperform even when accounting for black ancestry, showing that American blacks are uniquely smart when accounting for genetic heritage. This implies that the environmental suppression thesis is correct.
The assumption that the IQ of the USA counties is only 85 is an underestimate, since these countries also include whites, not just blacks. In assuming an IQ of 85 for these countries, I have actually underestimated the IQ of these counties. The “real IQ” of “pure Africans” could be even higher than I have projected here.
(See my article on why it is better to slightly risk nuclear war than to allow civilization to collapse).
Peak oil throws a wrench in this optimistic projection.
I could have adjusted for this by conducting a regional analysis and comparing the ratios of mtDNA, autosomal, and paternal ancestry, and interpolated values. I did not do this in the interest of time, preferring to publish results in a rougher form than split hairs over a few percentage points for more accurate estimates. If this is popular or generates paid interest, I can conduct this more rigorous analysis.
Due to the slave trade, the African maternal line is overrepresented, while the African paternal line is underrepresented, because most interracial pairings during slavery were between white masters and black female slaves. So if you find 15% mtDNA, the autosomal DNA is likely lower, perhaps as low as 7%.
Whenever a post takes me more than 4 days to research, I decide to stop and publish my results. If you guys really want me to look up all 195 Wikipedia pages on African ancestry, I will do that, just leave a comment as a paid subscriber. It will take me several hours. But the rest of these sources represent my attempt to engage with the genetic research. Here’s a discount.
https://pmc.ncbi.nlm.nih.gov/articles/PMC3718088/
https://pmc.ncbi.nlm.nih.gov/articles/PMC4109857/
https://bmcecolevol.biomedcentral.com/articles/10.1186/1471-2148-7-32
https://pmc.ncbi.nlm.nih.gov/articles/PMC8911814/
https://bmcecolevol.biomedcentral.com/articles/10.1186/1471-2148-11-288/tables/1
https://www.promega.com/-/media/files/resources/conference-proceedings/ishi-19/poster-abstracts/poster64.pdf?la=en
https://pmc.ncbi.nlm.nih.gov/articles/PMC2987384/
https://pmc.ncbi.nlm.nih.gov/articles/PMC3576335/
https://www.nature.com/articles/s41586-023-05754-w/tables/1
https://bmcgenomics.biomedcentral.com/articles/10.1186/s12864-019-6296-7
https://pmc.ncbi.nlm.nih.gov/articles/PMC7202134/
https://pmc.ncbi.nlm.nih.gov/articles/PMC3604014/
https://blog.23andme.com/articles/caribbean-latin-american
https://www.nature.com/articles/jhg201373#Tab1
https://web.archive.org/web/20160316152334/https://repositorio.unb.br/handle/10482/5542
https://antharky.ucalgary.ca/mccafferty/sites/antharky.ucalgary.ca.mccafferty/files/Nunez_et_al_2010.pdf
https://www.sciencedirect.com/science/article/pii/S1875176819300563#bib0040
2013, African and Non-African Admixture Components in African Americans and An African Caribbean Population: pmc.ncbi.nlm.nih.gov/articles/PMC3837693/
2013, African and Non-African Admixture Components in African Americans and An African Caribbean Population: pmc.ncbi.nlm.nih.gov/articles/PMC3837693/
2004, Ethiopian Mitochondrial DNA Heritage: Tracking Gene Flow Across and Around the Gate of Tears: https://pmc.ncbi.nlm.nih.gov/articles/PMC1182106/
2011, History Shaped the Geographic Distribution of Genomic Admixture on the Island of Puerto Rico: pmc.ncbi.nlm.nih.gov/articles/PMC3031579/
2021, Population Structure of the South West Indian Ocean Islands: Implications for Precision Medicine: pmc.ncbi.nlm.nih.gov/articles/PMC8653818/
2019, A systematic scoping review of the genetic ancestry of the Brazilian population: pmc.ncbi.nlm.nih.gov/articles/PMC6905439/
2013, Reconstructing the Population Genetic History of the Caribbean: pmc.ncbi.nlm.nih.gov/articles/PMC3828151/
2017, A Comparative Analysis of Genetic Ancestry and Admixture in the Colombian Populations of Chocó and Medellín: pmc.ncbi.nlm.nih.gov/articles/PMC5633392/
2014, Multiple ethnic origins of mitochondrial DNA lineages for the population of Mauritius: pubmed.ncbi.nlm.nih.gov/24676463/
2016, Medical genetics and genomic medicine in the Dominican Republic: challenges and opportunities: pmc.ncbi.nlm.nih.gov/articles/PMC4867558/
https://pmc.ncbi.nlm.nih.gov/articles/PMC8565749/
https://www.scielo.cl/scielo.php?script=sci_arttext&pid=S0034-98872014000300001&lng=en&nrm=iso&tlng=en
https://pmc.ncbi.nlm.nih.gov/articles/PMC8756502/
1998, Estimating African American Admixture Proportions by Use of Population-Specific Alleles: sciencedirect.com/science/article/pii/S0002929707616280
2012, The genetic landscape of Equatorial Guinea and the origin and migration routes of the Y chromosome haplogroup R-V88: nature.com/articles/ejhg2012167
2023, A genetic and linguistic analysis of the admixture histories of the islands of Cabo Verde: pmc.ncbi.nlm.nih.gov/articles/PMC10322156/
2020, Genome-wide analyses disclose the distinctive HLA architecture and the pharmacogenetic landscape of the Somali population: nature.com/articles/s41598-020-62645-0
2007, Dissecting the genetic history of São Tomé e Príncipe: a new window from Y-chromosome biallelic markers: pubmed.ncbi.nlm.nih.gov/17227478/
2011, Y-SNP analysis in an Angola population: doi.org/10.1016/j.fsigss.2011.09.046
https://www.sciencedirect.com/science/article/abs/pii/S187249731930305
A more complete analysis will put 55 ethnicities into a spreadsheet and find research for each one. This is rough. 195 countries to go.
https://pmc.ncbi.nlm.nih.gov/articles/PMC7501257/
https://pmc.ncbi.nlm.nih.gov/articles/PMC8333252/
2011, Genetic diversity on the Comoros Islands shows early seafaring as major determinant of human biocultural evolution in the Western Indian Ocean: pmc.ncbi.nlm.nih.gov/articles/PMC3039498/
https://pmc.ncbi.nlm.nih.gov/articles/PMC9119534/
https://web.archive.org/web/20180529202917/http://www.populstat.info/Africa/swazilag.htm
https://pmc.ncbi.nlm.nih.gov/articles/PMC4989113/
How do you find the time to gather so much data and write articles like this one?
Useful post, thanks.